The Facts Behind Our Fight
The Facts Behind Our Fight

The Facts Behind Our Fight

Evidence-Based Insights on Yick Wo’s Impact
This page presents essential data to inform the decision about Yick Wo Elementary’s future. From population density and walkability to commute times and student demographics, the data here highlights critical factors that impact the community. Special attention is given to the school's role in supporting underserved and special needs students, backed by clear statistics and research. Explore the visuals and data insights to understand why these numbers matter in the discussion about school closures.
In total, 13 schools are impacted by this decision: three will officially close, eight will merge with other schools, and two will serve as “welcoming schools” for the students of the closed schools. The selection criteria for elementary schools included having fewer than 260 students and falling within the lowest 50% of composite scores. High schools with fewer than 400 students were also considered for consolidation.
This decision is driven by a combination of declining enrollment—over 4,000 students have left since the 2017-2018 school year, with an additional drop of 4,600 projected by 2032—and a need to address the district’s financial challenges. SFUSD Superintendent Matt Wayne emphasized the difficulty of the situation, stating that there are no easy solutions and that significant staff reductions across the district will be necessary. While San Francisco Mayor London Breed has no direct influence over the school closures, she has stepped in to provide the district with a stabilization team to assist in navigating the crisis.
The list of affected schools still requires approval from the SFUSD board, with an initial vote set for November 12 and a final vote scheduled for December 10. Until then, community members, parents, and educators are mobilizing to voice their concerns and advocate for the preservation of their local schools.

Reference: SFUSD Closure/Merger Annoucement
District 3 encompasses some of the densest neighborhoods in San Francisco, with over 90,000 residents in specific census tracts. Maintaining elementary schools in this area is essential for the community, especially considering the impact of closures on densely populated zip codes like 94133.
Key Data Points:
Four densest zip codes largely fall within D3.
D3 hosts three of the schools targeted for closure.
Visuals:
Figure 1: Density by Census Tract
Table 1: Zip code density data for San Francisco
Figure 2: Density of SF zip codes with elementary school closures
District 3 is home to the densest areas of San Francisco, with most census tracts exceeding 90K people, making it one of the city's most concentrated neighborhoods.
Source: US Census Bureau
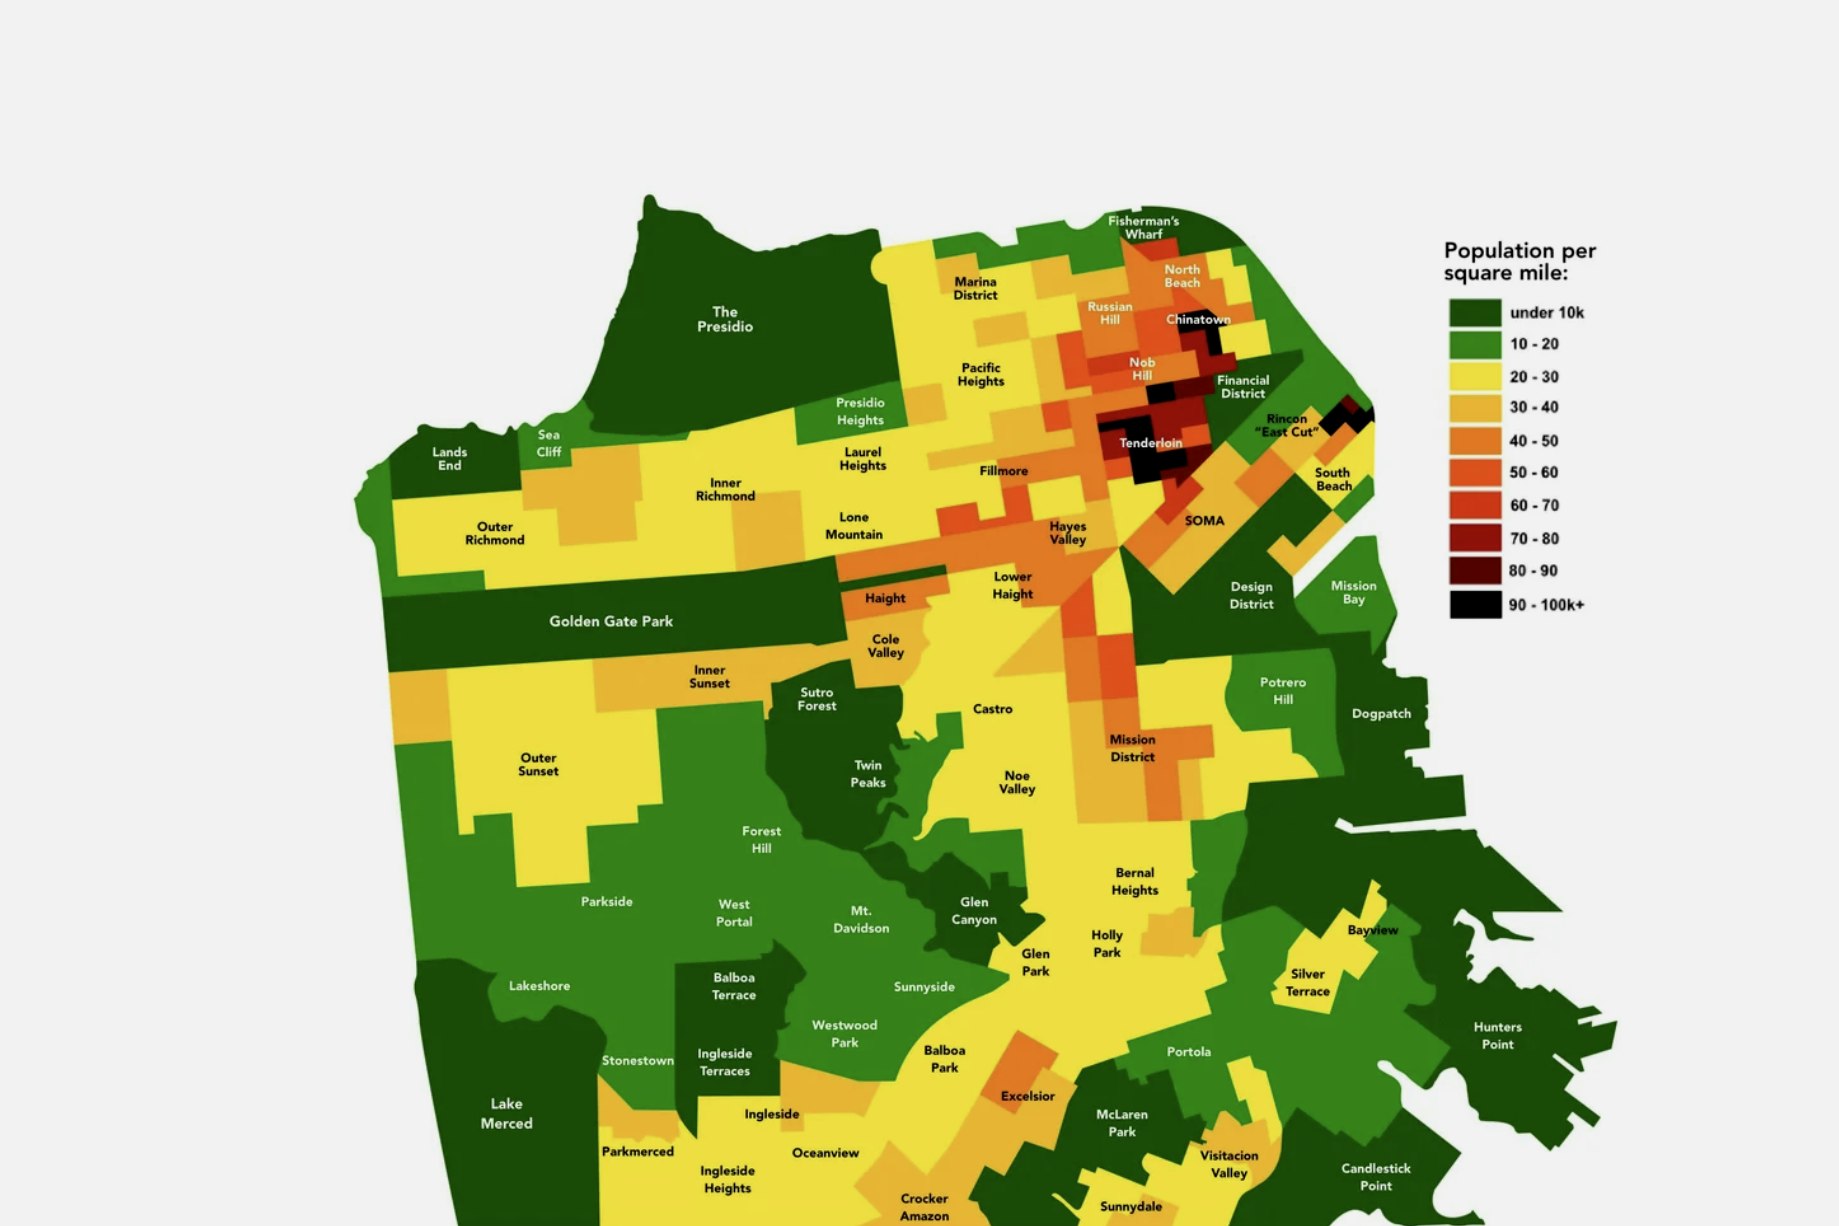
Table 1: Density by zip code, San Francisco (2024)

Source: Zip Atlas, verified using data from SimpleMaps
Figure 2: Density of SF zip codes with elementary school closures

Source: Zip Atlas, SFUSD.
The histogram labels represent the number of elementary schools on the closure list by zip code, with 94133 being the only zip code with two schools facing closure. Notably, three of the elementary schools on the list are located in District 3, two of which are in San Francisco’s four densest zip codes.
Yick Wo Elementary is located in one of the most walkable neighborhoods of San Francisco. With the highest walkability index, Yick Wo serves many students who walk to school daily, which is crucial for a community where car ownership is low.
Key Data Points:
Table 2: Walkability Index of 94133 schools.
Car ownership in zip codes 94133 and 94109 is significantly below the city average of 30%.
80% of Yick Wo students walk to school, based on a recent survey.
Visuals:
Table 3: Percentage of students walking to school by teacher.
Figure 3: Car ownership comparison for zip codes affected by school closures.
Zip code 94133, the hardest hit by school closures, is one of San Francisco's most walkable areas. This table shows the EPA's walkability index for the four schools in 94133. Schools in red are proposed for closure.
Source: EPA

Figure 3: Car ownership comparison for zip codes affected by school closures.
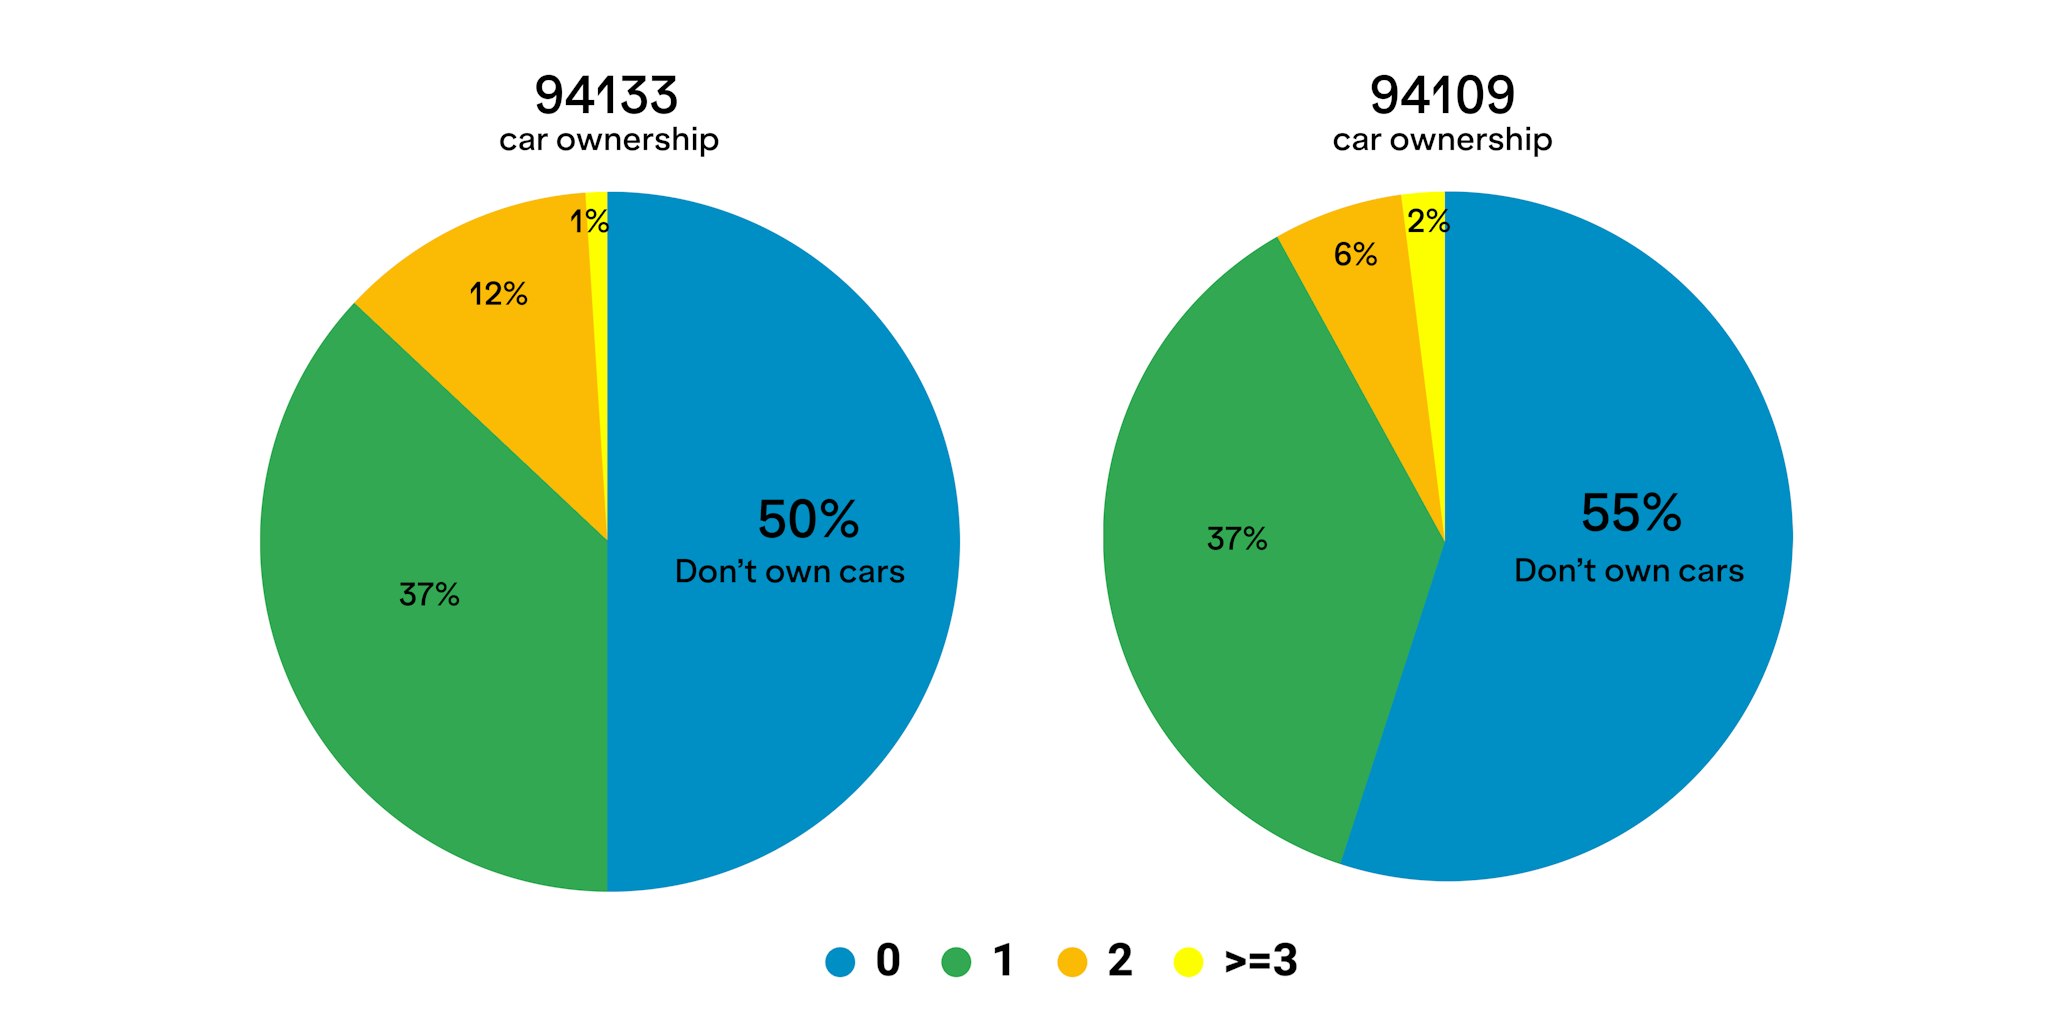
Zip code 94133, home to Yick Wo and Jean Parker, is the most affected by school closures, with two schools slated to close. In San Francisco, 30% of residents own no cars, but car ownership is significantly lower in these two impacted zip codes.
Source: Census Bureau, 2022 American Community Survey
Table 3:
% of students walking to school at Yick Wo
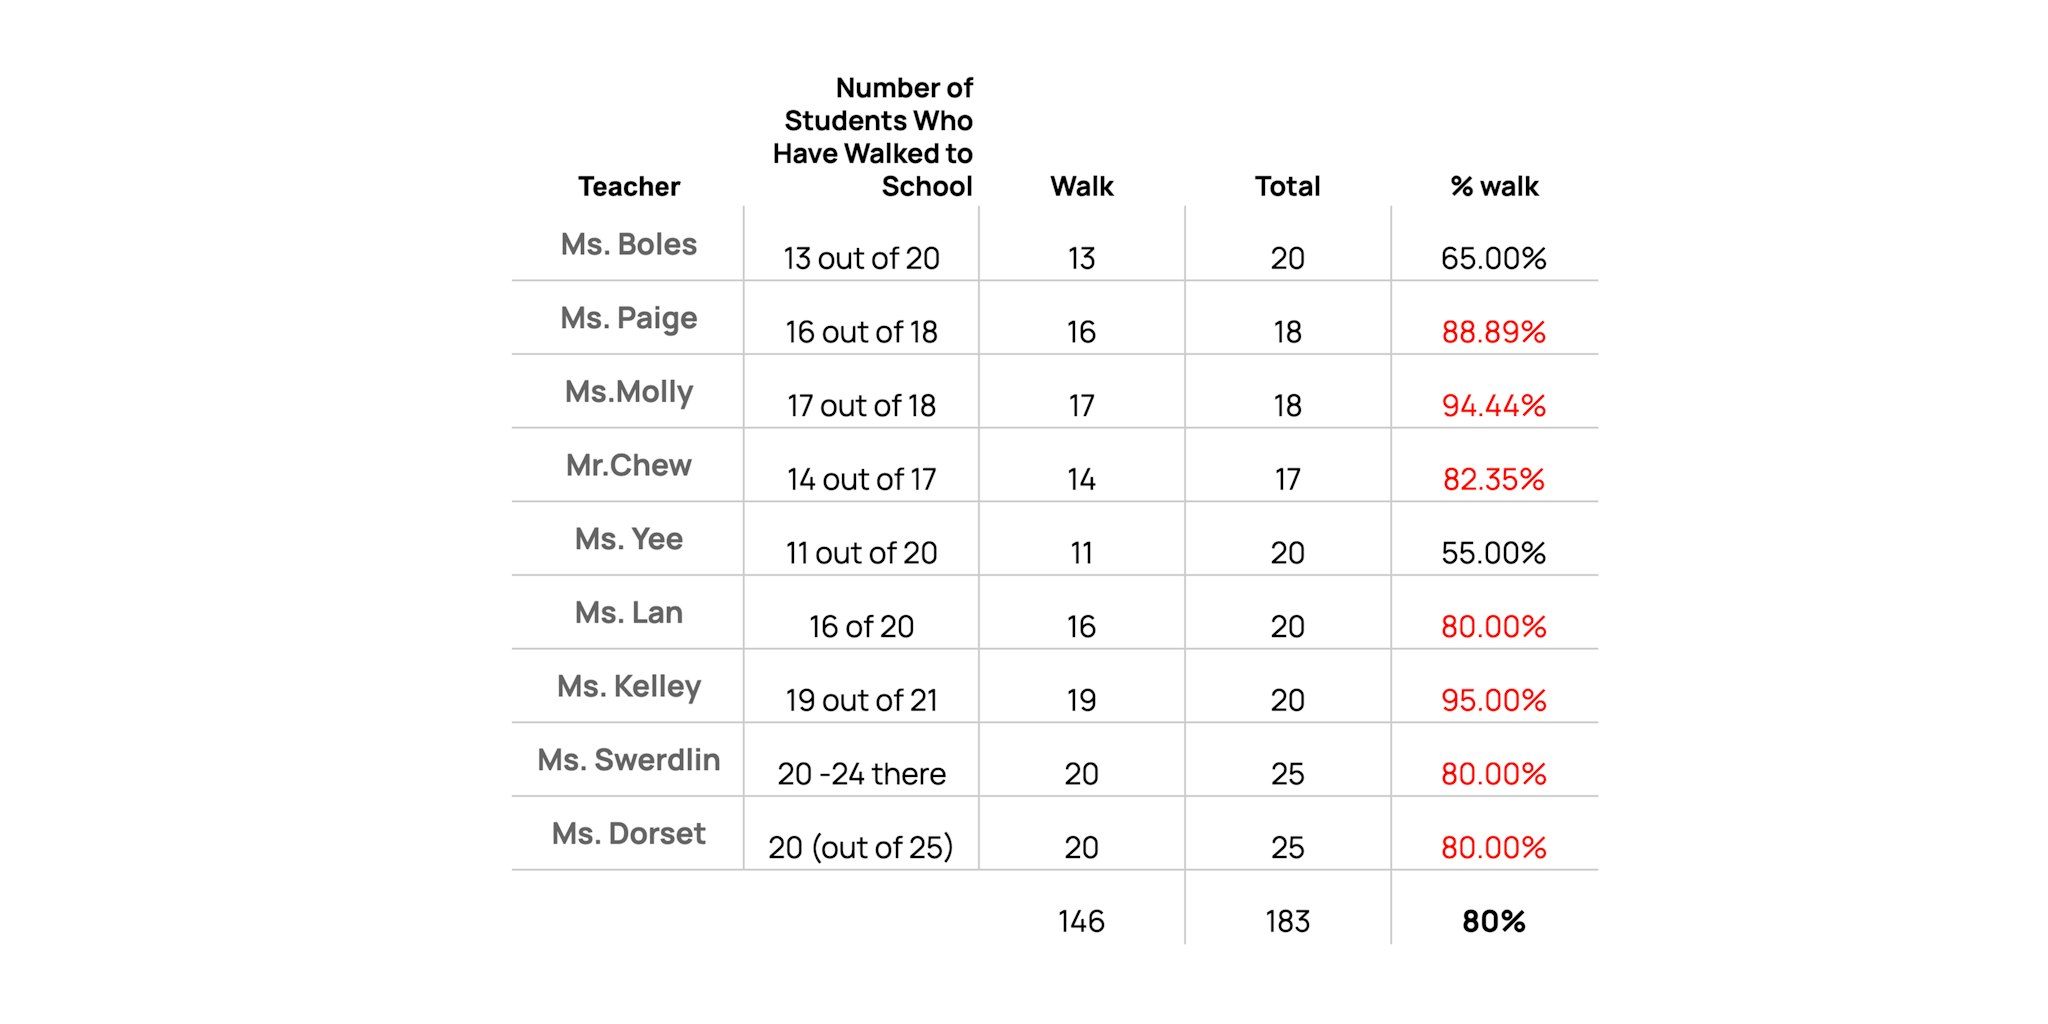
Source: preliminary evidence from survey conducted among students on 10/15. Students were asked if they walked to school on that specific day.
Table 4: Increased Commute Times

Highlighted in red are the most challenging routes, with no options under 10 minutes (unless driving). Wait times and round trips with young children further increase the burden, especially for Yick Wo and Spring Valley students after closures.
Source: Google Maps
District 3 is a hub of cultural diversity and socio-economic variance. Protecting schools in this area ensures that students from all backgrounds have equitable access to education, and it supports neighborhood cohesion.
Key Data Points:
Charts: Demographics and income by zip code.
Yick Wo outperforms nearby schools (Redding and Sherman) in equity, with a rating of 9/10 compared to 5/10, indicating better outcomes for underserved populations.
Visuals:
Equity and proficiency levels comparison for Yick Wo, Redding, and Sherman.
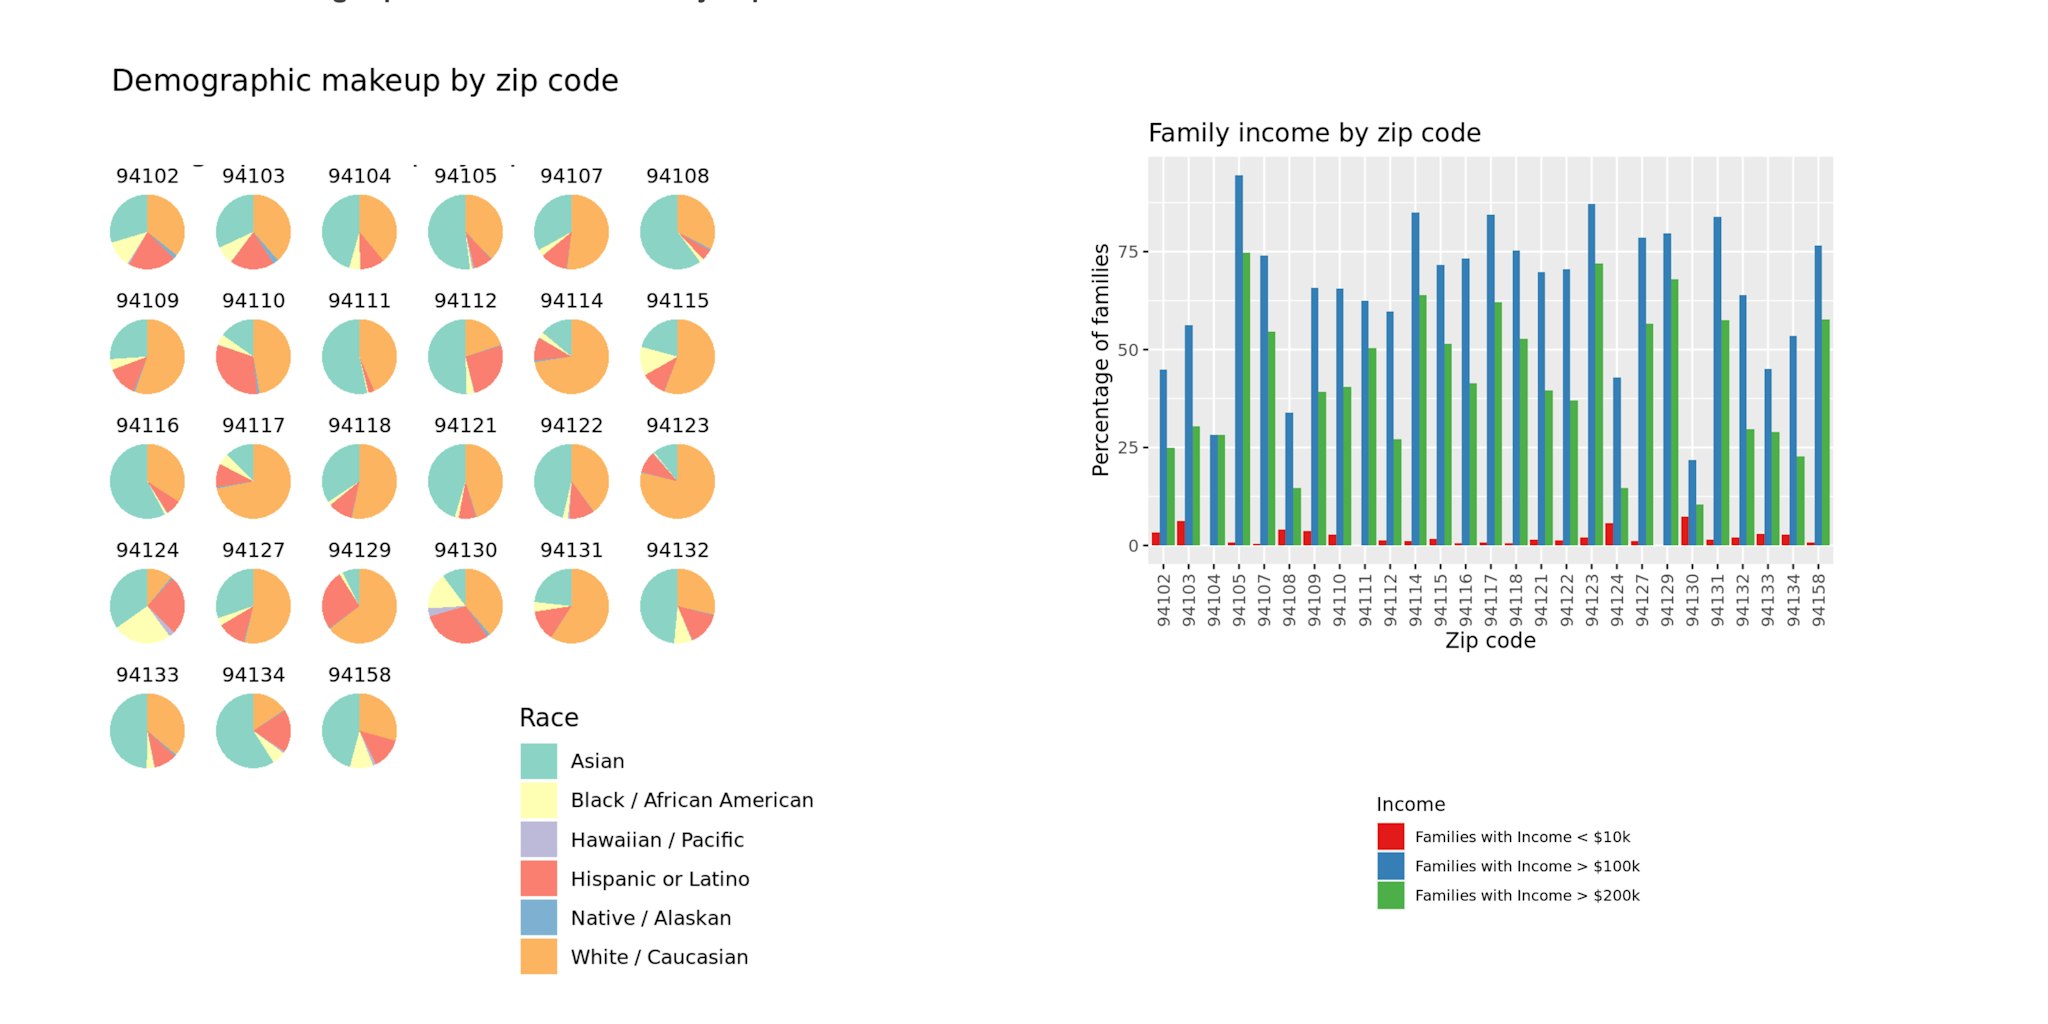
Left: Data source: ZIPatlas Right:Data source: ZIPatlas
Equity and Proficiency Levels: Yick Wo vs. Sherman and Redding

Yick Wo has an equity rating of 9/10, significantly higher than Sherman and Redding, which both have a rating of 5/10. This highlights that low-income and underserved students perform much better at Yick Wo compared to the schools proposed to absorb its students (source: GreatSchools.com, accessed 10-16-24).
Yick Wo’s strong Special Day Class (SDC) program provides critical support for students with Extensive Support Needs (ESN), particularly those with autism. Closing the school would severely disrupt these students’ progress and well-being.
Key Data Points:
20% of Yick Wo students are in special education, with a focus on ESN.
The school's unique location and programs (like the public pool integration) are integral to the SPED curriculum.
Visuals:
SFUSD Elementary Schools that offer special day classes (Extensive Support and focus on Autism)
Critical Commutes: Yick Wo's Special Education Students Face Displacement to Distant Schools

Yick Wo serves 20% special education students, with a strong focus on Extensive Support Needs (ESN) and Autism. The school has 2 fully enrolled Special Day Classes and is 1 of only 6 schools in SF with an ESN-Autism program, the only one in NE SF. Yick Wo’s small size and neighborhood integration provide a safe, supportive environment for students.
